
Introduction
Konnichiwa! Welcome to the AI Automation Dojo. Today, we are dissecting the desperate corporate quest to finally figure out what everyone is actually doing all day. We are tracking the evolution of process intelligence, moving from the Wild West of management-by-intuition all the way to the holistic zen of Productivity Mining.
I’m your host, Andrzej Kinastowski, one of the founders of Office Samurai – where we firmly believe that you simply cannot build a 21st-century digital workforce on the foundational premise of, “I think Bob usually copies this into Excel on Tuesdays”.
So, whether you are an executive demanding a 20% efficiency gain by Q3, or a tired employee who just wants to stop self-reporting their every move, you are in the right place. Now grab your favorite katana (or your most outdated, coffee-stained process map), and let’s get to it!
The risks of managing by intuition and gut feeling
Welcome back to the podcast. Today, we are looking at the evolution of process intelligence – or, as I like to call it, the desperate corporate quest to finally figure out what everyone is actually doing all day.
At Office Samurai, we have a slight, highly caffeinated obsession with process data. We spend our days building state-of-the-art automation ecosystems. But here is the catch: to build those seamless, intelligent workflows, you need to know exactly how the work is being done in the first place. You cannot build a 21st-century digital workforce on a foundational premise of, “I think Bob usually copies this into Excel on Tuesdays”. You need facts.
So, we have mapped out the maturity levels of how companies gather this data, and it is a fascinating journey. Let’s start at the very bottom.
Level 0: Total lack of process measurement
At Level Zero, absolutely nothing is measured.
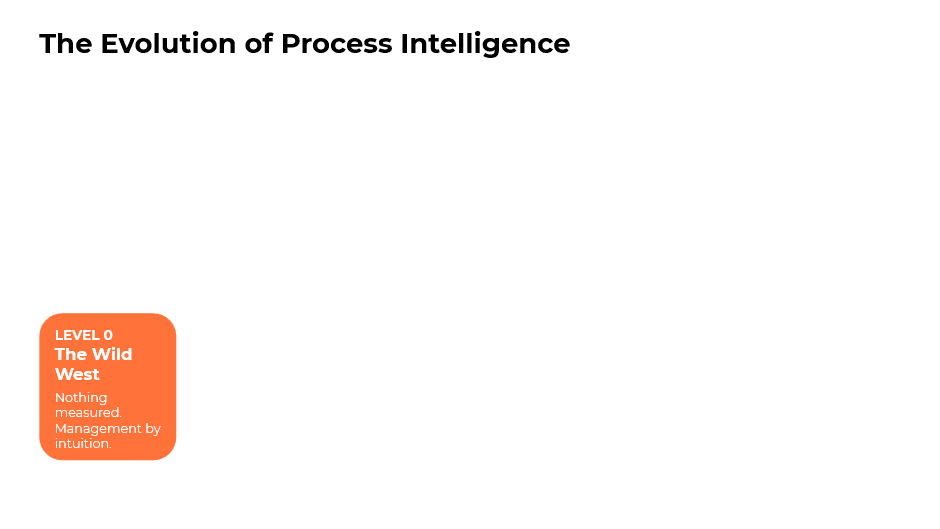
None of it. You are flying completely blind, managing your operations entirely on a hunch. Now, to be fair, this isn’t always born out of sheer corporate negligence. We were recently talking to a client setting up a shared services center, and the reality is that in places like Germany, strict regulations mean you sometimes aren’t even allowed to measure employee metrics. So, they simply don’t.
And here is the genuinely funny part – this actually works for a surprisingly long time. If you have a smart, energetic manager, they can keep the plates spinning based purely on their gut feeling. As long as the work roughly gets done and the building hasn’t caught fire, this baseline of “good enough” is perfectly fine for keeping the lights on.
But then comes the breaking point.
Eventually, some executive decides it is time to optimize, and suddenly you get hit with massive, structured targets for improvement. They want to see a 20% efficiency gain by Q3, and they want a PowerPoint deck proving it. That is exactly when “good enough” completely stops working. You cannot optimize a hunch. You cannot confidently deploy an advanced AI Agent when your entire process map is just an outdated Word document and a manager’s general vibe. You need structure, and more importantly, you need measurement.
And that realization is what pushes organizations out of the Wild West and into the incredibly tedious world of Level 1.
Level 1: Manual data collection and spreadsheet reporting
Welcome to Level 1.
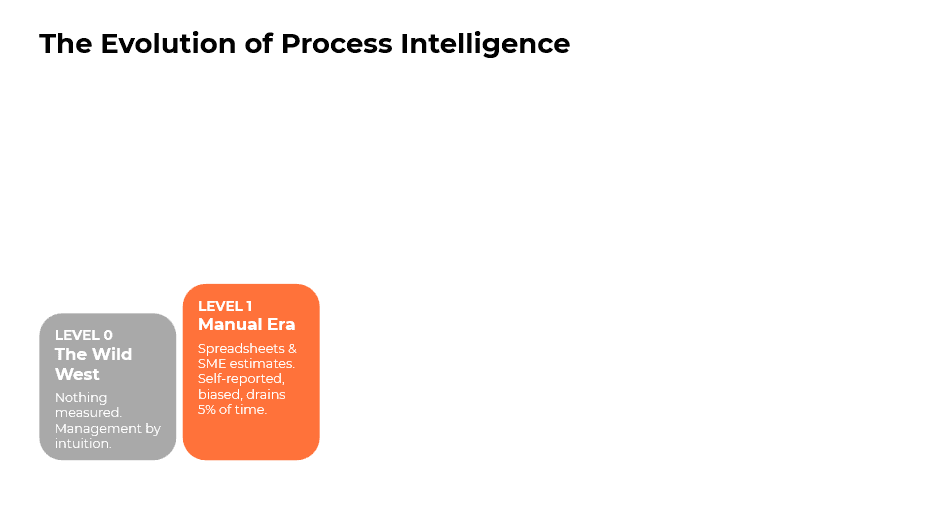
This is what we call Foundational Measurement, which is a very polite, consulting way of saying you are relying on manual, project-based data collection using spreadsheets and subjective estimates from your Subject Matter Experts. Instead of flying completely blind, you are now navigating the corporate seas with a hand-drawn map on a coffee-stained napkin.
Usually, this looks like a localized project where a team is asked to meticulously write down everything they do for a month. An employee sits at their desk at the end of the day and types, “I spent three hours on this task, and two hours on that task”. It gives management a baseline to look at, but it comes with a massive, hidden price tag.
Because this method is so intensely manual, it actively drains productivity. We have seen that the sheer act of logging this information, if done in proper detail, can consume up to 5% of an employee’s total time. Just let that sink in for a second. You are taking up to 5% of your entire workforce’s capacity and burning it purely on the act of writing down what they are doing with the rest of their day. It is the operational equivalent of paying someone to watch you sleep.
Then we run headfirst into the “Human Bias” problem. Because this data is entirely self-reported, it is deeply prone to inaccuracies and subjective bias. If people feel they are being evaluated for a promotion or a performance review, they are absolutely going to tweak their numbers to look as busy as possible. You are getting declarative data, meaning you only know what people tell you they are doing, not what is actually happening.
Furthermore, this method completely fails to capture your team’s real capacity. Thanks to Parkinson’s Law, work will magically expand to fill whatever time the employee wrote down in that spreadsheet. If they have eight hours to do four hours of actual work, the spreadsheet will somehow perfectly reflect eight hours of grueling labor.
And to put the final nail in the coffin of Level 1: employees absolutely hate it. It is deeply frustrating, it is tedious, it is remarkably difficult to scale across an enterprise, and it rarely gives you the continuous data you need to spot actual trends.
This frustration inevitably leads companies to look for a better way – which brings us to Level 2.
Level 2: Transitioning to scalable time-tracking software
So, your workforce is on the verge of open rebellion because you are making them spend five percent of their lives filling out a spreadsheet about how they spend their lives. What does management do? They pivot. They buy software.
Welcome to Level 2.

This is the web-based shift, where we introduce scalable platforms like TimeCamp, Harvest, or Prohance for constant measurement. We have essentially upgraded from the hand-drawn, coffee-stained napkin to a sleek, cloud-hosted dashboard. This is the era of Software as a Service, meaning you are now paying around 5-10 dollars per user, every single month, for the privilege of having them click a drop-down menu.
To be completely fair, Level 2 does bring some actual efficiency gains to the table. The data aggregation and reporting are entirely automated. You no longer need an analyst to spend three days consolidating Excel files; the tool just spits out an ugly pie chart on demand. Plus, this automated reporting reduces the sheer labor intensity of tracking time down. So, congratulations – you just bought back a tiny fraction of your company’s capacity. Don’t spend it all in one place.
But then we run face-first into the Accuracy Gap. Level 2 might be digital, and real-time clicking is absolutely better than end-of-day guessing, but it still suffers from the exact same fatal flaw as Level 1: it relies entirely on human beings pressing buttons. It is still heavily prone to inaccuracies and subjective bias. Your employee finishes a task, gets up to grab a coffee, runs into a coworker, discusses the 2nd season of The Pitt for twenty minutes, and completely forgets to hit “stop” on their timer.
More importantly, this method gives you a painfully surface-level view. It tells you that Brenda spent four hours in the “Invoice Processing” category. Fantastic. Did she process one invoice or one hundred? Were there errors? Did she have to open six different legacy systems to do it? The tool has absolutely no idea. It completely fails to provide deep insights into actual productivity or true capacity.
You are no longer flying blind, but you are basically looking at your operations through a frosted glass window. You know someone is moving around in there, but you have no earthly idea how the work is actually getting done. And when companies realize that paying a monthly subscription fee hasn’t magically mapped their complex workflows, they inevitably start looking for a way to capture the actual desktop reality.
Enter Level 3.
Level 3: Task Mining – recording desktop activity
So, you are tired of looking at your operations through that frosted glass window. You do not just want to know how long Brenda was in the invoice system; you want to know what buttons she actually clicked to make the magic happen.
Welcome to Level 3.

This is Task Mining, or as I like to think of it, the era of capturing the desktop reality.
At this stage, we bring in specialized tools like UiPath’s, Microsoft’s, or Nintex’s to record user activity directly on the desktop. We are finally getting granular data on specific, repetitive tasks. Instead of just high-level time categories, these tools analyze the actual behavior of users across various applications. You get to see the exact sequence of steps, which systems are touched, and how the task is physically executed. It is a massive step up from relying on a spreadsheet and an employee’s end-of-day memory.
But before you pop the corporate champagne and declare victory over operational blindness, let’s talk about the fatal flaw. We call it the “Happy Path” Trap.
These tools usually require user activation, meaning the employee has to manually click a “start” button before they begin. And let’s be deeply honest about human nature here. If you know you are being officially recorded to show management how a process works, what do you do? You pick the absolute perfect, pristine, least complicated transaction in your entire queue to demonstrate. You record the “happy path”. You are definitely not going to record the messy, chaotic business exceptions that actually drain your day.
Because of this digital stage fright, the timing data you get is often wildly non-representative. A flawless, five-minute recorded sprint on a basic task does not mean the employee can magically crank out a 100 of them in an eight-hour shift. Furthermore, because of the setup and processing required, this approach is usually limited in scope to a small team of maybe 5 to 10 people working on pre-defined process templates.
So, is it just a high-tech novelty? Not at all. Task Mining is incredibly useful if you treat it as a localized project rather than a continuous, enterprise-wide monitoring solution. It is practically custom-built for generating the skeleton of a process map or drafting Standard Operating Procedures. If you are handing a process over to a developer to build an automation, and your current documentation is just a vague bulleted list from 2018, Task Mining will give you the foundational flow you need to start building.
It gives you the steps, but it still lacks the massive scale and continuous background pulse of a true enterprise solution. And that realization is exactly what pushes organizations to stop asking the users to record themselves, and start asking the systems directly – which brings us to Level 4.
Level 4: Process Mining – analyzing enterprise system logs
So, you have realized that asking your employees to self-report their workday is a terrible idea, and making them record their screens only gives you the “best behavior” version of your processes. You are tired of opinions. You want cold, hard, indisputable facts.
Welcome to Level 4.

This is Process Mining.
At this stage, we bring in the heavy machinery. We are talking about large-scale, automated discovery tools like Celonis, SAP Signavio, or UiPath Process Mining. Instead of watching the user, these tools take a core systems approach by analyzing the event logs directly from your massive enterprise systems, like your ERP or CRM.
This is a phenomenal leap forward because we are finally prioritizing facts over opinions. Process mining takes a “Lean Management” perspective by tracking the “true” flow of a single, specific item – like one invoice or one purchase order – as it travels through your system. You get to see the exact digital footprint it leaves behind, completely removing the human bias from the equation. For organizations with highly centralized processes that are heavily reliant on a system like SAP, this level can squeeze out an incredible amount of efficiency.
But, much like a brand-new sports car, it comes with a few massive blind spots and a terrifying price tag.
Let’s talk about the blind spots first. Process mining is brilliant at telling you what happens inside the system that is generating the logs. But what happens outside of it? Probably 80 to 90% of process mining projects end up focusing almost entirely on SAP. That is great, except for the inconvenient truth that a massive chunk of corporate work actually happens in Outlook, Excel, older legacy web apps, or even third-party portals that simply do not generate accessible logs. You might have a perfectly mapped SAP workflow, but the system is completely blind to the fact that your employee spent three hours wrestling with a broken Excel macro just to get the data into SAP in the first place. You are getting an incredibly detailed picture, but you are only looking at part of the canvas.
Then we have the incredibly high bar of entry. We are not talking about a 10-dollar monthly subscription anymore. These are expensive tools that require very expensive consultants to implement. Setting this up requires complex integration into each of your core systems. If you have 60 different instances of SAP running on different configurations, unifying that data is a monumental task. We have seen clients back out of process mining entirely because they were handed a 6 million euro proposal and simply could not guarantee that the resulting efficiencies would ever cover that initial cost. It requires a huge upfront investment of both time and budget before you see that first beautiful, automated dashboard.
So, Level 4 gives you the absolute truth, provided you can afford it and provided that truth lives entirely within your main ERP. But what if you want to see everything? What if you want the truth of the system and the reality of the user’s desktop, without bankrupting your department?
That realization is exactly what pushes us toward the holistic future of Level 5.
Level 5: Productivity Mining – holistic workflow visibility
So, you have realized that Level 4 gives you the absolute truth, provided you can afford it and provided that truth lives entirely within your main ERP. But what if you want to see everything? What if you want the truth of the system and the reality of the user’s desktop, without bankrupting your department?
Welcome to Level 5.

Productivity Mining.
This is where platforms like KYP.ai and Soroco enter the chat. Unlike the manual clicking of Level 2 or the stage-fright recordings of Level 3, this stage is all about passively and holistically capturing end-to-end processes across all applications without requiring a single manual input from the user. You install a lightweight application, and it just runs in the background, quietly taking notes.
And before your HR department has a collective panic attack about surveillance, let’s clarify how this works. The system is configured to only measure behavior inside designated “productive” applications – like your ERP, Outlook, or Excel. If an employee switches over to Facebook or fires up Spotify, the tool immediately stops tracking. It only cares about the work, not your team’s questionable taste in true crime podcasts.
This brings us to the User-Centric View. Process Mining at Level 4 tracks a single item, like an invoice, as it flows through the pristine pipes of SAP. Productivity Mining flips the camera and watches the actual human being. It balances the perspective between how the system flows and how people actually work. It sees that to process that one invoice, your employee had to open three different legacy web apps, copy data into a chaotic Excel spreadsheet, wait for a broken portal to load, and type notes into a random Notepad file because the main system crashed. It captures all the messy app-switching and real-world workarounds. While it might have a slightly less granular view of deep system logs compared to Process Mining, you can actually combine the two levels for incredible synergies. You get the system’s absolute truth seamlessly paired with the user’s desktop reality.
And Speed to Value aspect? With traditional log-based Process Mining, you might spend months and millions of euros just integrating your 60 different SAP instances before you see a single chart. With Productivity Mining, because it is a passive measurement on the desktop, the deployment is incredibly fast and comes with significantly lower costs. From day one of the installation, you are gathering real, non-declarative data. Your workforce gets to reclaim that 5% of their day they used to spend filling out tedious time-tracking spreadsheets.
Now, let’s be completely clear – this is not magic. The tool is not going to miraculously spit out a perfect business case or automatically draw a flawless process map all by itself. Data is just data. It hands you the exact coordinates of your bottlenecks and shows you the prime candidates for automation, but you still need human analysts to look at that data, understand it, and fix the broken pipes. But at least now, you are fixing reality, not optimizing a manager’s hunch.
Ethics & Compliance: Measurement vs. Employee Surveillance
So, we have climbed the mountain. We have gone from guessing on napkins to passively measuring exact digital footprints. Everything is great, right? Well, let’s talk about the dark side. Let’s talk about what we lovingly refer to as Level 666.

Because with great data comes a great temptation to become a corporate supervillain. Every single tool we have talked about – especially the advanced productivity mining ones – can absolutely be weaponized if you give it to a manager who has control issues.
This is where wrongly used process intelligence can cross the ethical boundary into outright spyware. We are talking about using these platforms not to find bottlenecks, but to find out if an employee took four minutes in the bathroom instead of their allocated three. We are talking about using enterprise software as a high-tech excuse to hunt for reasons to fire people.
And this is why Change Management is not just a buzzword; it is a survival tactic. If you do not explicitly tell your employees what you are measuring, why you are measuring it, and what happens to the data, they will inevitably find out. And when they do, the trust is gone. Remember Level 1, where people faked the spreadsheets? If a manager uses this new data to yell at an employee who efficiently finished their work in four hours, that employee is not going to magically do twice the work tomorrow. They will just stretch that exact same four-hour task to perfectly fill an eight-hour shift. Congratulations, you just used a million-dollar tool to incentivize malicious compliance.
This leads us perfectly into the Data Trap. Data itself does not fix a broken culture, it just illuminates it. If your process is awful, the dashboard will simply be a highly accurate, real-time map of your awfulness. You still need actual, human analysts to sit down, look at the data, and fix the plumbing.
Summary: Choosing the right maturity level for your company
Which brings us to the ultimate question: Which level is your organization actually on?
You do not necessarily need to jump straight to Level 5. It is about strategic fit. If your processes are entirely locked inside a massive, centralized SAP environment, maybe Level 4 Process Mining is your sweet spot. If you just need to map out a single messy workflow for a developer to build an automation, a localized Level 3 Task Mining project might be exactly what you need. You match the tool to your organization’s maturity, rather than just buying the shiniest software because the vendor bought you a really nice steak dinner.
At Office Samurai, this is exactly what we do. We help you navigate this entire spectrum without losing your mind – or your budget. Whether we are deploying UiPath to unearth your system logs or capture desktop activity, or using KYP.ai to passively map the holistic reality of your users’ desktops, we help you find the truth.
Because at the end of the day, you cannot optimize a gut feeling. You need facts. You need process intelligence.


